Interactions Correctly?


10 Data Analytics Tools for 2026 Compared by Features and Use Cases


Join a hands-on bootcamp on data preparation, tracking and reporting, led by Xerago's analytics experts.
Choosing a data analytics tool starts with the question you need to answer. Tableau, Power BI and Data Studio help teams explore and report on data, while Spark, Hadoop and TensorFlow support different processing or modeling tasks. Comparing them by category makes it easier to build a shortlist that fits your business.
Which tools suit business dashboards, predictive analysis or large-scale processing, and when do you also need a dedicated web analytics platform?
This 2026 guide compares ten tools by their main use case and implementation needs, then explains how to choose tools for digital analytics and turn the resulting data into useful decisions.
Use the comparison below to identify relevant options before reviewing the individual tools. The list covers several categories; the order is not a performance ranking.
Access Your Complete Data Preparation Guide[ Free Analytics Checklist ]
Data Analytics Tools to Compare in 2026
- SAS Visual Analytics on SAS Viya
- Tableau
- Power BI
- Qlik Sense and Qlik Cloud Analytics
- IBM Cognos
- Apache Spark
- KNIME
- Hadoop
- TensorFlow
- Data Studio formerly Looker Studio
What Is Data Analytics?
Data analytics is the process of examining raw data to uncover trends, patterns, and actionable insights. It helps organizations make informed decisions, improve customer experiences, optimize operations, and drive revenue growth. Data analytics can be descriptive, diagnostic, predictive, or prescriptive, each serving unique business needs.
Data analysis and data analytics overlap. Analysis can investigate historical or current data, while analytics often includes the wider workflow of preparing, interpreting and using data. Neither term is limited to predicting future trends.
Let’s dive into the top data analytics tools that are transforming businesses worldwide.
Why Are Data Analytics Tools Important?
Data analytics tools are software applications or platforms designed to collect, organize, process, and analyze data. They help businesses and individuals uncover meaningful patterns, trends, and insights from raw data. Here’s why they’re important.
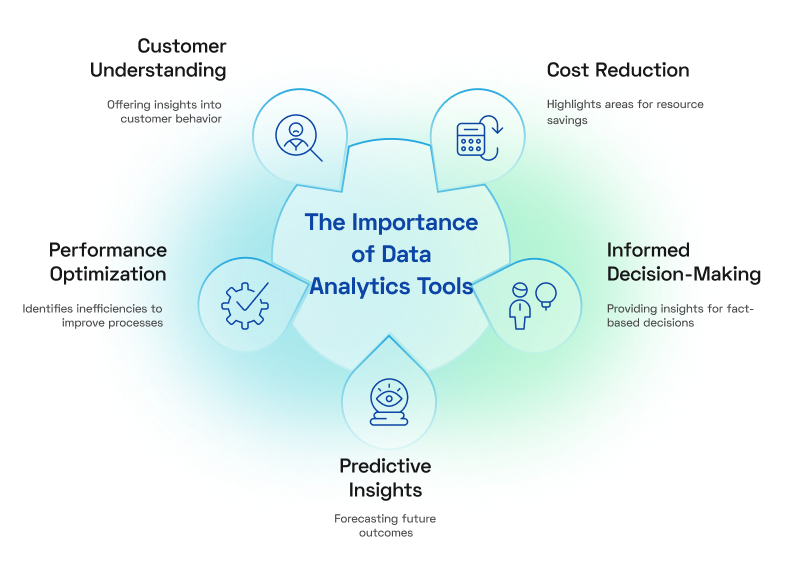
- Informed Decision-Making: They provide insights that help businesses make fact-based decisions.
- Performance Optimization: Identify inefficiencies and improve operational processes.
- Customer Understanding: Gain insights into customer behavior, preferences, and trends.
- Predictive Insights: Forecast future outcomes to stay ahead of trends.
- Cost Reduction: Highlight areas where resources can be saved or better utilized.
The right tool can't fix the wrong data
Before you compare dashboards, check whether your events, definitions and data sources are reliable. Xerago's Digital Analytics team can review your current setup and show where the gaps are.
Top 10 Data Analytics Tools to Help You Make Better Decisions
From understanding customer journeys to identifying areas for improvement, each tool offers unique features tailored to different business needs. The following is a list of top data analytics tools, each with its distinct strengths and best use cases.
1. SAS Visual Analytics on SAS Viya

Best for enterprise reporting and analytical exploration
SAS Visual Analytics on SAS Viya supports visual exploration, interactive reporting and augmented analytics. Evaluate the specific SAS components needed for advanced forecasting or model deployment; those capabilities should not be assumed to be included in every reporting configuration.
Features of SAS Business Intelligence:
- Interactive Dashboards: Build reports and explore business metrics. Confirm the data-refresh setup needed for the decisions your dashboard supports.
- Analytical Exploration: Explore relationships and trends; verify which additional components your forecasting or modeling use case requires.
- Advanced Data Integration: Seamlessly combines data from multiple sources for unified analysis.
- Collaboration Tools: Enables teams to share insights and reports effortlessly, promoting data-driven decision-making.
2. Tableau
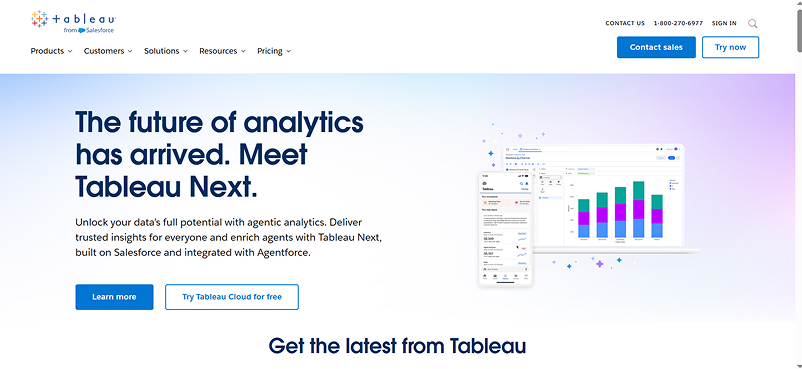
Tableau is a leading data visualization tool designed for ease of use and flexibility. Its drag-and-drop interface enables users to create visually appealing and interactive reports without requiring advanced technical skills. Tableau supports a wide range of data sources, making it a go-to choice for organizations looking to simplify data storytelling.
Features of Tableau:
- Data Visualization: Turns raw data into charts, maps, and dashboards that are easy to understand.
- Data Connections: Tableau can use live connections or extracts. The freshness of a dashboard depends on the connection, source and refresh configuration.
- Data Integration: Supports connections to multiple data sources, including cloud services and databases.
- Collaborative Sharing: Allows users to share dashboards and insights securely with stakeholders.
2026 update: Tableau’s August release lists the Semantic Model Builder Smart Canvas as generally available in Tableau Next, while Tableau Agent data connection and analytics creation are beta capabilities. Check the product and edition you are evaluating before assuming those features are included. [3]
3. Power BI
Power BI by Microsoft is a business analytics tool that transforms data into meaningful insights using interactive dashboards and reports. Its seamless integration with Microsoft Office products and Azure makes it a natural choice for businesses already in the Microsoft ecosystem.
Features of Power BI:
- Interactive Dashboards: Provides dynamic visualizations that are easy to customize.
- AI Assistance: Copilot can assist with analysis and report creation. Its use requires a supported paid Fabric or Power BI Premium capacity, relevant tenant settings and regional availability. A user license alone does not establish access; some experiences remain in preview.
- Cloud Accessibility: Enables teams to access reports from anywhere via the cloud.
- Integration with Microsoft Tools: Works seamlessly with Excel, Teams, and other Microsoft applications.
Selection check: Budget for report authors, viewers, sharing arrangements and any required capacity. Test a representative dataset and permission model before deciding whether Power BI meets your cost and usability requirements. [5]
4. Qlik Sense and Qlik Cloud Analytics
Qlik Sense is a self-service analytics platform that empowers users to explore and analyze data on their own terms. It uses an associative engine that allows users to investigate data relationships freely, uncovering insights that traditional tools might miss.
For a current cloud shortlist, also evaluate Qlik Cloud Analytics. Qlik positions it as building on Qlik Sense with AI-driven analytics and automation. Confirm the deployment, edition and available features against your own requirements. [6]
Features of Qlik Sense:
- Associative Data Model: Lets users explore data without being limited by predefined paths.
- Smart Visualizations: Automatically suggests the best ways to visualize data based on its structure.
- Data Integration: Merges data from multiple sources for a comprehensive view.
- AI-Assisted Analytics: Provides context-aware insights and recommendations.
5. IBM Cognos Analytics
IBM Cognos is a robust business intelligence platform that combines AI with advanced reporting and data visualization tools. Its intuitive interface makes it easy for users to build and customize reports, while its AI-driven features enhance insights and decision-making.
Features of IBM Cognos Analytics:
- AI-Powered Recommendations: Offers insights and trend analysis with minimal manual input.
- Custom Dashboards: Allows users to create tailored views of key metrics.
- Data Governance: Certified models and security controls support consistent reporting and access management. The organization still needs to configure and maintain the controls appropriate to its deployment.
- Mobile Accessibility: Enables users to access dashboards and reports on the go.
6. Apache Spark
Apache Spark is an open-source data processing framework designed for big data and machine learning applications. Known for its speed and scalability, Spark can handle large datasets and perform real-time data analysis.
Features of Apache Spark:
- Distributed Processing: Spark distributes computation across resources. Benchmark your own workload; a universal claim that it is 100 times faster does not describe every dataset or deployment.
- Stream Processing: Structured Streaming supports incremental processing of incoming data and uses micro-batches by default. Actual latency depends on the workload, infrastructure and pipeline configuration.
- Machine Learning Libraries: Includes tools for predictive modeling and AI.
- Multi-Language Support: Works with popular programming languages like Python, Java, and R.
- Selection check: Spark is a processing engine, so a business reporting use case may also need storage, orchestration and a dashboard layer. Include engineering and operational costs in the comparison.
7. KNIME
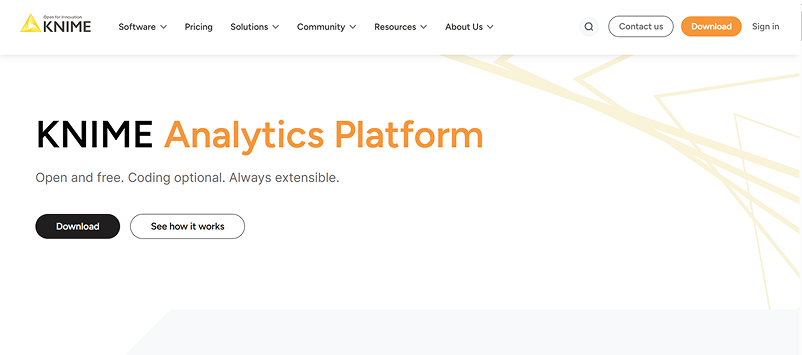
KNIME is an open-source platform for data analytics, reporting, and integration. It offers a drag-and-drop interface for creating workflows, making it accessible to both technical and non-technical users. KNIME excels in helping businesses uncover actionable insights without requiring coding expertise.
Features of KNIME:
- Workflow Automation: Simplifies complex analytics tasks with an easy-to-use interface.
- Data Blending: Combines data from different sources for comprehensive analysis.
- Machine Learning: Supports predictive analytics with built-in machine learning tools.
- Custom Extensions: Offers a wide range of plugins to expand functionality.
8. Hadoop
Hadoop is an open-source framework for distributed storage and processing of large datasets. It’s designed to handle vast amounts of data efficiently, making it a popular choice for big data projects.
Features of Hadoop:
- Scalable Storage: Spreads data across multiple servers to accommodate growth.
- Distributed Processing: Processes data across clusters for faster results.
- Infrastructure Cost: Hadoop can run on commodity hardware, but storage, cluster administration, security and support still contribute to the total cost.
- Fault Tolerance: Maintains performance even if hardware failures occur.
9. TensorFlow
TensorFlow is an open-source framework for building machine learning and AI applications. Developed by Google, it’s widely used for creating models ranging from simple data predictions to advanced deep learning algorithms.
Features of TensorFlow:
- Scalable AI Models: Build and deploy machine learning models that adapt to your needs.
- Cross-Platform Support: Works on mobile, web, and server environments.
- Extensive Libraries: Offers pre-built components to simplify development.
- Community Support: Backed by a large community for resources and troubleshooting.
Selection check: TensorFlow is a machine-learning framework for building and deploying models. It requires model development, validation and maintenance, rather than providing business dashboards out of the box.
10. Data Studio formerly Looker Studio
Data Studio is Google’s no-cost tool for customizable dashboards and reports, with a separate Pro offering. Google restored the Data Studio name in April 2026 after the product had been called Looker Studio. It connects to sources such as Google Analytics, Google Ads, BigQuery and Google Sheets.
Features of Google Data Studio:
- Interactive Dashboards: Create dynamic and visually appealing reports with customizable charts and graphs.
- Easy Data Integration: Connects effortlessly with Google services (e.g., Google Analytics, Google Ads) and other external data sources.
- Collaboration: Share reports with viewing or editing permissions and collaborate with other editors.
- Customizable Templates: Provides pre-built templates to jumpstart your reporting.
- Data Freshness: Report freshness depends on the connector, its settings and the underlying data source. Automatic refresh should not be described as universal real-time reporting.
Choosing Web and Digital Analytics Tools
If the task is understanding website behavior or product adoption, add a dedicated digital analytics platform to the shortlist. Reporting tools can visualize its output, but they do not automatically collect the events needed for behavioral analysis.
| Platform | Use case to evaluate | Implementation consideration |
|---|---|---|
| Google Analytics 4 | Website and app events and configured funnel analysis | Validate events, consent and funnel definitions. |
| Adobe Analytics | Enterprise digital behavior analysis | Plan implementation, dimensions and reporting ownership. |
| Mixpanel | Product events, conversion funnels and retention | Define event names, identity and relevant cohorts. |
| Matomo | Web analytics with a self-hosting option | Review hosting, security and privacy configuration. |
Choose based on the journey and implementation you need. Define events, identity, consent and metric ownership before evaluating whether a tool’s reports answer the business question.
Data Analytics Tools Comparison
| Tool | Main category and use case | Selection consideration |
|---|---|---|
| SAS Visual Analytics | Enterprise BI and analytical exploration | Confirm components for forecasting and deployment. |
| Tableau | Visualization and interactive exploration | Check live versus extract data and product-specific AI access. |
| Power BI | Business reporting in the Microsoft ecosystem | Check sharing, capacity and semantic-model requirements. |
| Qlik Sense / Qlik Cloud Analytics | Associative exploration and BI | Confirm cloud versus client-managed deployment and edition. |
| IBM Cognos Analytics | Governed enterprise reports and dashboards | Plan certified models, permissions and administration. |
| Apache Spark | Distributed data processing and streaming | Requires engineering and a reporting layer where needed. |
| KNIME | Visual data preparation and analytical workflows | Separate the free application from team deployment needs. |
| Apache Hadoop | Distributed storage and processing | Include cluster operations and existing architecture fit. |
| TensorFlow | Machine-learning model development | Requires modeling expertise and lifecycle management. |
| Data Studio | Shareable dashboards and connected-source reporting | No-cost base tool; check Pro, connector and source costs. |
How the Main Analytics Tool Categories Differ
Business intelligence and visualization tools turn prepared data into reports and dashboards. Digital analytics tools collect and analyze configured website or app events. Data preparation and processing tools transform source data, while machine-learning frameworks support model development. Many enterprises use more than one category because each supports a different part of the workflow.
How Data Analytics Tools Are Applied Across Industries and Use Cases
Data analytics tools are only valuable when they solve real operational problems. From improving customer targeting to accelerating risk assessment, here’s how leading industries apply them effectively.
Retail
Retailers use tools like Tableau and Power BI to analyze inventory movement, in-store vs. online purchasing behavior, and customer segmentation. These insights help adjust merchandising strategies, localize promotions, and improve inventory accuracy across channels.
For example, retailers often use real-time dashboards to track product performance across regions and optimize restocking workflows without relying solely on end-of-quarter sales data.
Finance
Banks and insurance providers can combine analytical platforms for reporting and risk analysis with processing engines such as Spark for large transaction datasets. Fraud or credit-scoring use cases also require suitable models, validation and operational integration; a dashboard alone does not provide these capabilities.
Healthcare
Healthcare teams can use workflow and reporting tools to combine permitted operational data for appointment scheduling, resource allocation and outcomes reporting. Any clinical decision-support use requires separate clinical validation and governance, beyond the general analytics features described here.
Many healthcare institutions rely on analytics platforms to monitor treatment efficacy and optimize bed management during peak demand.
E-commerce
E-commerce teams can use an event-based platform such as Mixpanel to investigate product views, cart activity and conversion funnels, then use Data Studio for reporting across connected sources. Data Studio presents data from its sources; it does not itself replace website or app event collection.
Businesses also use these tools to segment users by lifetime value or purchasing frequency, supporting more focused retention efforts.
Marketing & Advertising Agencies
Agencies can use GA4 to investigate campaign traffic and configured conversion funnels, then connect the relevant data to a reporting tool. Measurement depends on implementation, consent, channel definitions and attribution settings; it does not automatically reveal every interaction across every channel.
Cross-channel attribution and campaign cohort analysis are key use cases that drive improved reporting and higher client retention.
How to Get Actionable Insights from Analytics Platforms
Start with a decision such as reducing checkout abandonment, then define the event or business metric that represents it. Check data completeness and the reporting time window before investigating the result. Compare relevant segments, identify a plausible explanation and agree on an action with an owner.
For example, a checkout completion drop on one browser should lead to checking event coverage and the browser experience before changing a campaign. After the fix, measure completion over a comparable period or use a controlled test. A dashboard highlights the change; useful analysis connects it to a validated action.
Which Analytics Tools Improve Operational Visibility
Reporting tools such as Power BI, Tableau, Qlik and Cognos are candidates when teams need shared views of orders, service performance or inventory. Assess source coverage, metric definitions, access controls and data freshness against the operational decision. A dashboard updated daily may suit planning, while an incident-response workflow may need a faster pipeline.
Selecting the right data analytics tool is critical to leveraging data effectively for your business. With so many options available, making the best choice requires evaluating your specific needs, goals, and technical capabilities. Here’s a step-by-step guide to help you choose the right tool:
- Define Your Goals: Identify what you aim to achieve, such as tracking website performance, improving customer retention, or optimizing marketing campaigns.
- Assess Business Needs: Choose tools suited to your business size, whether you're a small business needing simplicity or a large enterprise requiring advanced analytics.
- Check Data Integration: Ensure the tool integrates with your platforms (e.g., CRM, marketing tools) and supports all data sources like websites or apps.
- Evaluate Features: Match capabilities to the task. Distinguish reporting, event analysis, data preparation and model development so the shortlist compares tools that solve the same problem.
- Ease of Use: Ask the people who will use the tool to complete a representative task, such as investigating a conversion drop or building a governed report. Check where SQL, coding or administrator support is needed.
- Scalability: Opt for scalable tools if your business is growing.
- Consider Cost: Compare software licenses, viewer access, connectors, compute, hosting and ongoing support. A free application can still require paid infrastructure or substantial operating work.
- Privacy and Governance: Review data collection, consent handling, retention, access permissions and storage location for the proposed setup. A privacy-oriented product does not automatically make its implementation compliant.
- Trial and Testing: Use free trials or demos to test features, integration, and ease of use before committing.
- Read Reviews: Check reviews and case studies to learn how the tool performs for businesses similar to yours.
- Support and Community: Ensure the tool provides reliable customer support, training, or a strong user community, especially for platforms offering advanced business intelligence features.
Conclusion
Choose your analytics tools around the decision, data and team that will use them. A reporting platform may be enough for a business dashboard; a large-scale processing or machine-learning use case will need a different set of capabilities. Test the shortlist against the same data and task before committing.
Before adding another tool, check whether the current problem comes from missing events, inconsistent definitions, stale data or limited analysis capabilities. Fixing the measurement foundation can make the tools you already own more useful.
Get accurate analytics with Xerago
20+ years of MarTech and analytics consulting for banking, insurance, telecom, retail and healthcare enterprises. Share a reporting discrepancy or a journey you can't measure, and we'll show you what to fix first.
Frequently Asked Questions
1 Which data analytics tool is best for business dashboards
Power BI, Tableau, Qlik, IBM Cognos Analytics and SAS Visual Analytics are candidates for business reporting. Compare them using your actual data sources, sharing model, governance requirements and team skills. There is no single best option for every organization.
2 What is the difference between data analytics and web analytics tools
Data analytics tools can support reporting, preparation, processing or modeling across business data. Web analytics tools focus on configured website or app interactions. A team can use a web analytics platform to collect events and a BI platform to report on combined business data.
3 Which data visualization tools should I compare
Start with Tableau, Power BI, Qlik, Cognos, SAS Visual Analytics or Data Studio when the task is reports and dashboards. Spark, Hadoop and TensorFlow serve processing or modeling tasks and should not be treated as direct dashboard alternatives.
4 Which data analytics tools are free
Data Studio has a no-cost base offering, and KNIME Analytics Platform is free and open source. Spark, Hadoop and TensorFlow are open-source projects. Hosting, compute, premium connectors and managed deployment can still cost money, so compare the full operating cost. [9][10][11][12]
5 Is Google Data Studio now called Looker Studio
Google renamed the product Looker Studio in 2022, then restored the Data Studio name in April 2026. The current Google documentation calls it Data Studio, and existing Looker Studio URLs redirect to its new domain. [12]
6 How do I turn analytics reports into actionable insights
Define a decision and metric, validate the data, compare the relevant segments and investigate a plausible cause. Assign an action to an owner and measure its effect. For example, investigate a device-specific checkout drop before reallocating campaign spend.
7 Do AI analytics tools fix inaccurate data
AI assistance can help explore data and generate reports, but missing events, inconsistent definitions or unsuitable models can still produce misleading results. Validate the measurement and semantic definitions, and review generated answers before acting. AI feature access also depends on the product and deployment. [4]
8 How can Xerago help improve analytics accuracy
Xerago’s Digital Analytics services address tracking and attribution requirements. Bring a reporting discrepancy or customer journey you cannot measure reliably to discuss the implementation and measurement work it needs. [18]
Ram Prabhakar
Head of Solutions and Content
Xtelligence Inbox.
Your weekly dose of marketing smarts!
Related Posts