Interactions Correctly?


The Ultimate Guide to Customer Loyalty Data Analytics


Get Free Access to Customer Services Metrics Calculator
Introduction
Businesses should know that retaining customers is as important as acquiring new ones. In fact, it is often more cost-effective and beneficial in the long run. Customer loyalty leads to repeat purchases, positive word-of-mouth, and a strong brand reputation. Loyal customers tend to spend more, are more forgiving of occasional mistakes, and provide valuable feedback that can help improve products and services.
But how can businesses truly understand what keeps their customers coming back? The answer lies in customer loyalty analytics.
It involves collecting and analyzing data on customer behaviors, preferences, and interactions with your brand. It helps businesses gain deep insights into customer satisfaction, identify patterns and trends, and predict future behaviors.
In this guide, we'll explain customer loyalty analytics, why it's important, how to measure and analyze customer loyalty, and how it can be used to grow your business. Whether you're new to this concept or looking to learn more, this guide will provide you with the knowledge you need to get started.
Understanding Customer Loyalty Analytics
Customer loyalty analytics entails the metrics and key performance indicators (KPIs) used to measure and evaluate customer loyalty and satisfaction. These analytics enable you to assess current loyalty levels, identify areas for improvement in the customer experience, and track the effectiveness of loyalty-building efforts over time.
Why analyzing customer loyalty is important?
According to a study by Frederick Reichheld, “A 5% increase in customer retention can lead to a 25-95% increase in profit”. So, it's clear that customer loyalty analytics isn't just beneficial; it's essential for maximizing profitability and long-term success.
Here's why it's so important:
- By understanding what makes your customers tick, you can make smarter choices about where to focus your efforts. Whether it's tweaking marketing strategies or improving products, customer loyalty analytics provides the roadmap.
- It's not just about making sales; it's about building relationships. Customer loyalty analytics help you understand your customers better and create personalized interactions that facilitate long-term loyalty and trust.
- Happy customers stick around. Customer loyalty analytics spot red flags early, so that you can address issues before they lead to customer churn.
- Loyal customers are valuable customers. They not only spend more but also spread the word about their favorite brands. Customer loyalty analytics identify these valuable customers and tailor their offerings to keep them coming back for more.
How do you measure and analyze customer loyalty?
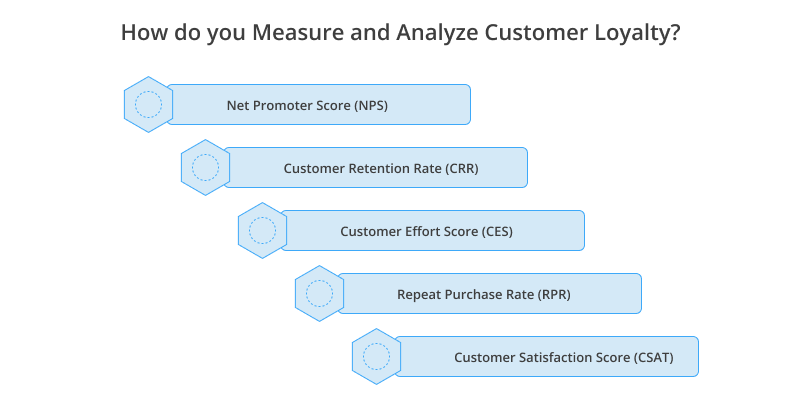
Measuring and analyzing customer loyalty is essential for understanding how well a business is performing in retaining its customer base. Here's a detailed look at the key metrics and methods used:
- Net Promoter Score (NPS)
- Customer Retention Rate (CRR)
- Customer Effort Score (CES)
- Repeat Purchase Rate (RPR)
- Customer Satisfaction Score (CSAT)
1. Net Promoter Score (NPS)
Net Promoter Score (NPS) is a metric that measures the likelihood of customers recommending a company's products or services to others. It is calculated based on responses to a single question: "On a scale of 0 to 10, how likely are you to recommend our company/product/service to a friend or colleague?".
The respondents are categorized into three groups:
Promoters (score 9-10): Loyal customers who are likely to make repeat purchases and recommend the company to others.
Passives (score 7-8): Customers who are satisfied with your product or service but aren't enthusiastic about it. They could easily switch to a competitor if they find a better offer.
Detractors (score 0-6): Unhappy customers who are unlikely to buy again and may discourage others from buying.
The NPS is calculated by subtracting the percentage of detractors from the percentage of promoters, resulting in a score that ranges from -100 to +100.
This score provides a clear and simple measure of a company's customer loyalty and potential for growth through word-of-mouth marketing.
Let's say out of 100 respondents:
60 customers are Promoters (score 9-10)
20 customers are Passives (score 7-8)
20 customers are Detractors (score 0-6)
𝑁𝑃𝑆 = 60% − 20% = 40 %
NPS of 40% indicates that the majority of customers are promoters, there's still room for improvement to reduce the number of detractors and increase overall satisfaction and loyalty.
2. Customer Retention Rate (CRR)
Customer Retention Rate measures the percentage of customers a business retains over a specific period. It helps assess how successful a company is in keeping its existing customers.
Here's a breakdown of how it works:
Customer Retention Rate determines the proportion of customers who continue to do business with a company from the beginning to the end of a specific period.
To calculate the Customer Retention Rate, follow these steps:
- Determine the number of customers at the end of the period (E).
- Subtract the number of new customers acquired during that period (N).
- Divide the result by the number of customers at the start of the period (S).
- Multiply by 100 to get the percentage.
[Customer Retention Rate = ((𝐸−𝑁)/𝑆) x 100]
For Example:
Start of the period: 500 customers (S)
End of the period: 450 customers (E)
New customers acquired: 100 (N)
Customer Retention Rate=( (450−100) / 500) x 100 = 70%
This means the company retained 70% of its original customers over the period.
A high retention rate indicates strong customer loyalty and satisfaction, suggesting that customers are happy with the product or service and choose to stay. Conversely, a low retention rate can signal underlying issues that need addressing, such as poor customer service, inferior product quality, or better offerings from competitors.
3. Customer Effort Score (CES)
Customer Effort Score evaluates how much effort a customer has to put into interacting with your company. The lower the effort, the better the score, indicating a more positive customer experience.
To calculate CES, you ask customers to rate their experience based on a specific question like, “How easy was it to get the help you wanted today?” Responses are then averaged to produce the CES.
Let's say you survey 200 customers and ask them to rate their experience on a scale of 1 to 7, where 1 means “very difficult” and 7 means “very easy.” The responses are as follows:
50 customers rate the experience as 7
75 customers rate it as 6
50 customers rate it as 5
25 customers rate it as 4
To calculate the CES:
Add up all the scores: (50 x 7) + (75 x 6) + (50 x 5) + (25 x 4) = 350 + 450 + 250 + 100 = 1150
Divide by the total number of responses: 1150 / 200 = 5.75
The CES in this case is 5.75, indicating that on average, customers found their interaction relatively easy.
A high CES indicates that customers find it easy to interact with your company, which is likely to enhance satisfaction and loyalty. Conversely, a low CES suggests that customers face challenges and may become frustrated, leading to a higher risk of churn.
4. Repeat Purchase Rate (RPR)
Repeat Purchase Rate is a key metric that measures the percentage of customers who make more than one purchase from a company within a specific period. It reflects the company’s ability to generate repeat business and maintain customer loyalty.
Let's break down how it works
How it works: To calculate the Repeat Purchase Rate, follow these steps:
- Determine the total number of customers who made more than one purchase during the period.
- Divide this number by the total number of customers who made at least one purchase during the period.
- Multiply the result by 100 to express it as a percentage.
Total number of customers: 500
Number of customers who made more than one purchase: 300
Repeat Purchase Rate = (300 / 500) ×100 = 60%
This means 60% of the customers made more than one purchase during the specified period which indicates a high level of customer loyalty and satisfaction.
A high Repeat Purchase Rate shows that customers are satisfied and willing to return for more purchases, which is a sign of strong customer loyalty.
5. Customer Satisfaction Score (CSAT)
Customer Satisfaction Score (CSAT) is a metric that measures how satisfied customers are with a company's products, services, or specific interactions. It is usually collected through surveys immediately following a purchase or interaction.
CSAT gauges the level of customer satisfaction by asking customers to rate their experience on a scale, typically from 1 to 5 or 1 to 10, where higher scores indicate higher satisfaction.
To calculate CSAT, follow these steps:
- Collect customer ratings from surveys.
- Add up all the scores.
- Divide the sum by the total number of responses.
- Multiply by 100 to convert it into a percentage if needed.
Total number of responses: 200
The sum of all scores: 800
CSAT = (800 / 200) = 4
If the scale is 1 to 5, the average score is 4 out of 5, indicating a high level of customer satisfaction.
High CSAT scores indicate that customers are happy with the company’s offerings and are likely to return, while low scores can highlight areas that need improvement. It’s a straightforward way to measure the success of customer service and product quality.
Conclusion
This blog aims to guide you through the essentials of customer loyalty analytics, highlighting its significance and the strategic benefits it offers. By applying these concepts, you can improve retention rates, strengthen customer relationships, and achieve greater success. To get the most out of customer loyalty analytics, start using these key metrics now. Understand your customers better, customize your strategies to fit their needs, and build lasting relationships. Loyal customers are your biggest supporters. Focus on keeping them happy to boost your growth and success.
Ram Prabhakar
Head of Solutions and Content
Xtelligence Inbox.
Your weekly dose of marketing smarts!
Related Posts