
You are in Digital Analytics - E-commerce Analytics
Measure What Returns Are Really Costing You
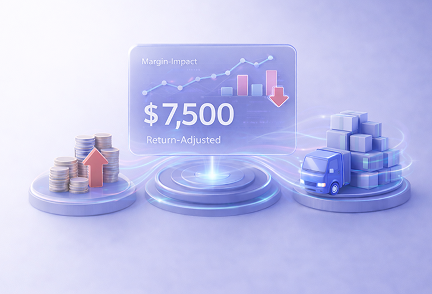
Connect operational return data to product and channel performance before margin erosion scales
Are Returns Being Processed Without Measuring Their Profit Impact?
Return codes are captured at fulfillment. Refunds are approved. Reverse logistics is executed. None of it is connected to product-level margin or marketing channel analytics.
Return Data Disconnected

What Happens: Warehouse captures return codes. Analytics tracks sales. Two datasets never integrated. Return insights invisible to marketing teams.
Real Scenario: Top-selling SKU shows strong revenue. Warehouse return codes show repeated size mismatch. Datasets never connected. Marketing scales product unaware returns destroying margin. Profitability erosion invisible.

Channel ROI Ignores Returns
What Happens: Marketing dashboards measure revenue and conversion. Return-adjusted profitability not incorporated. High-return channels appear profitable.
Real Scenario: Paid social drives high sales volume appearing successful. Return rates 40% higher than organic. Dashboard shows only revenue. Channel budget increases. Returns erode profit gains completely.

Profitability Stops at Revenue
What Happens: Reports focus on revenue and units sold. Return costs, reverse logistics, restocking excluded from product analysis. Profitability unknown.
Real Scenario: Product revenue reports show bestseller status. Return costs, reverse logistics fees, restocking labor excluded from analysis. Appears profitable. Actually loses money after returns. Margin negative.

How We Fix It
We connect return reason data directly to product, channel, and profitability analytics.
What We Build
A consolidated analytics layer linking warehouse return codes with product, SKU, and channel performance.
How We Build It
- Integrate warehouse return reason codes into the analytics data model for insights
- Map returns to product SKUs and customer segments to identify return behavior trends
- Align return timestamps with sales and channel attribution data for accurate analysis

What We Build
A margin-impact framework that incorporates return frequency and cost into performance reporting.
How We Build It
- Calculate return-adjusted revenue per SKU to reflect true product-level profitability
- Include reverse logistics and restocking costs in margin models for accurate cost views
- Segment return impact by channel and campaign to identify high-risk acquisition sources
What We Build
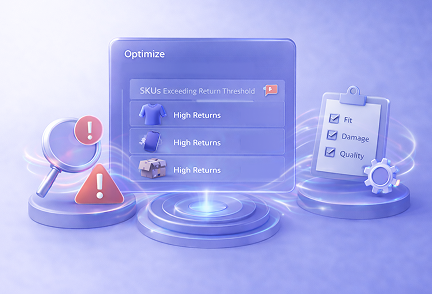
A decision framework that surfaces products and channels requiring intervention.
How We Build It
- Flag SKUs exceeding return thresholds to surface product-level profitability risks faster
- Identify recurring return patterns such as fit, damage, and product quality issues
- Trigger category-level or vendor-level reviews to reduce repeat return drivers effectively


What You Get
Return visibility connected to profitability.
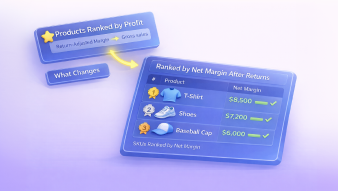
Products Ranked by Profit
Return-adjusted margin replaces gross sales.
SKUs ranked by net margin after returns instead of revenue performance hiding size mismatch destroying profitability.
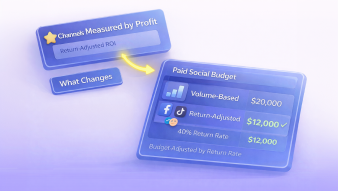
Channels Measured by Profit
Marketing spend aligned with return-adjusted ROI.
Paid social budget adjusted for 40% return rate instead of increased based on volume while returns destroy gains.
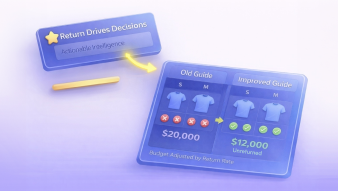
Return Drive Decisions
Warehouse logs become actionable intelligence.
Size mismatch patterns trigger sizing guide improvements instead of return codes sitting in warehouse system disconnected.
Digital Analytics Products for Real-Time Decisions
Enterprise-ready analytics products that standardize measurement, reduce noise, and keep decisions aligned in real time.

Continuously analyze data and surface insights automatically
Get early alerts when performance drops, translate data into clear summaries for non-analysts, and uncover patterns and anomalies manual reporting often misses.
Book a Demo →From Reporting to Control. In Four Moves.
Most analytics stop at visibility. We build the system that drives action.
Start with a Bootcamp
Bootcamp
 (5 Days)
Fix one decision blocker fast
We start with one live problem: attribution disputes, delayed performance signals, fragmented journeys, or profit blind spots.
In 5 days, we rebuild that loop end-to-end across the systems involved, so the number becomes usable, not debatable.
You see the fix working on your data, with clear before/after impact.

Launchpad
(60 Days)Make the fix production-grade and run it daily
Once it works, we take it live with real traffic, real refresh schedules, and real ownership.
Monitoring and guardrails are added so performance doesn’t drift silently and definitions don’t get reinterpreted team by team.
By day 60, your teams can operate the system without depending on manual reconciliation cycles.
Rollout
Expand the same control loop across more decisions
With the foundation in place, we scale the pattern to the next bottleneck. Budget optimization, cohort retention, channel ROI, margin leakage, or journey drop-offs.
Each rollout moves faster because you’re not rebuilding identity, metrics, and signal flows from scratch.
Over time, analytics stops being a project and starts behaving like an operating capability.
Digital OS
Run analytics as an always-on decision layer
At this stage, analytics becomes the control layer that keeps the business aligned in real time.
Signals stay current. Attribution stays consistent. Journeys stay connected. Profit stays visible.
Teams don’t wait for monthly reporting to act. They adjust execution continuously, with confidence.
Case Studies From Real Enterprise Environments.
What broke, how we fixed it, and what the numbers showed.
View Case StudyCustomer journeys optimized using unified digital analytics
Web, mobile, and portal touchpoints were unified under a single analytics framework. Adobe Analytics was re-implemented to capture meaningful events and ensure accurate journey measurement.
Decision-Ready Analytics Starts Here
Attribution disputes. Stale performance. Split journeys. Pick one. We make it reliable enough to run daily.
Built with Enterprise-Grade Partners
20 years building on Adobe, Salesforce, IBM, HCL, SAS, and Microsoft. We know how to make them work as one system.


Customer Endorsements
"Congrats and thanks to entire Xerago team. The policy persistency model is live now, and development was done with clinical precision. It has an accuracy of 95%."
— Senior Vice-President, A Large Private Insurance Company, India
Digital Analytics Insights from the Field
Perspectives shaped by real analytics breakdowns and real production fixes.

Google Analytics 4 vs Adobe Analytics What Actually Changes
How data models, measurement depth, and enterprise needs determine the right analytics platform choice.
Read article
Choosing the Right Marketing Analytics Tools
How different analytics tools shape measurement, attribution, and decision-making across marketing teams.
Read article
Amplitude vs Adobe Analytics Product or Marketing Analytics
Where product behavior tracking ends and enterprise marketing analytics begins, and why it matters.
Read article