
How to Do a Digital Analytics Audit And Finally Trust the Numbers Behind Every Decision
Written by: Sanjana R
Updated on: 24-05-2026

DIGITAL ANALYTICS AUDIT BOOTCAMP
Your GA4 data is wrong somewhere. Our team finds exactly where in 5 days.

The most dangerous analytics failures do not look like failures. They look like strong conversion rates. Channels outperforming expectations. Campaigns that appear to be working. The measurement layer underneath never announces when it breaks. It just quietly makes the data wrong in ways that surface as performance signals rather than errors. By the time the real picture emerges months of decisions have already been built on top of it.
Why Digital Analytics Problems Are Less Visible
When your CRM goes down, you know. When your site goes down, you know. When a campaign stops spending, you know. These failures are visible. They surface immediately. They get fixed.
Measurement failures are invisible by design.
A duplicate purchase event does not throw an error. It makes your conversion rate look better. A UTM parameter stripped at a redirect does not show up as a gap. It shows up as direct traffic, which looks normal. A consent configuration that blocks your tag container does not alert anyone. It just quietly removes a percentage of real sessions from every report you act on.
That is not a technology problem. Your analytics platform is working. Your tag management system is working. The failure is in the layer between what your users actually do and what your analytics records them doing. That layer breaks constantly, silently, and in ways that look like performance rather than failure. Every measurement failure starts with how digital analytics data is collected, connected, and acted on across your stack.
Every enterprise running a digital analytics stack, whether it is Google Analytics, Adobe Analytics, Mixpanel, Amplitude, or a combination of platforms feeding into a BI layer carries this risk. The tools are working. The measurement layer underneath them is not.
Here is how to find exactly where your analytics environment is producing numbers nobody has verified.
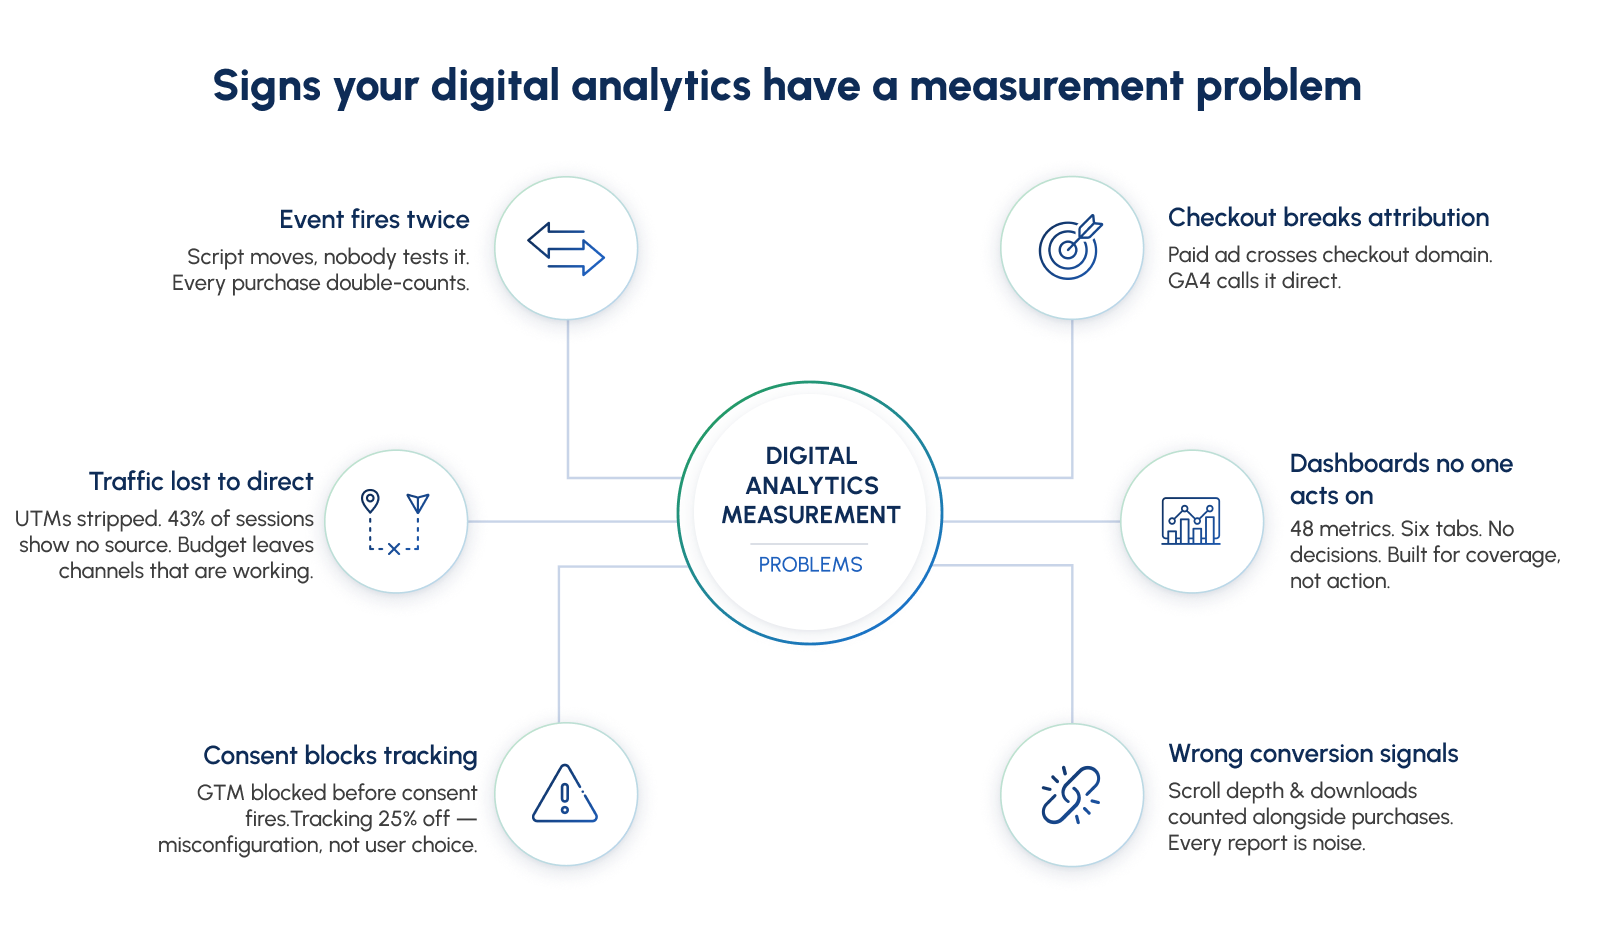
Signs Your Digital Analytics Has a Measurement Problem
01: Your Conversion Numbers Do Not Match Your Actual Orders
Your analytics platform reports more conversions than your backend order records for the same period. The gap is not rounding. It is not timing. It is your measurement environment counting the same transaction more than once.
Every budget decision built on that conversion number is built on an inflated foundation.
02: Direct Traffic Is Unusually High While Paid Campaigns Are Running
Direct traffic above 20 percent of total sessions during active paid campaigns is not brand recognition. It is an attribution failure. Paid sessions are arriving without identifiable source and medium and getting absorbed into direct.
The paid channels are working. Your digital analytics reporting cannot see them working.
03: Conversion Source Resets to Direct at Checkout
Sessions arriving from paid and organic channels show their correct source across your main site. The moment they cross to your checkout or payment domain, the source resets to direct.
Every conversion recorded after that boundary is misattributed regardless of what actually drove the visit.
04: Sessions Dropped After Your Consent Banner Went Live
A measurable drop in tracked sessions appeared after your consent management platform was deployed. No campaign change. No traffic drop. Just fewer sessions reaching your analytics platform than before.
That is not users declining consent. That is an implementation failure removing real users from every report before consent was ever offered.
05: Your Conversion List Includes Events That Are Not Business Outcomes
Open your conversion event list right now. If scroll depth thresholds, video plays, PDF downloads, or newsletter signups sit alongside completed purchases, your attribution model is distributing credit across engagement noise and real revenue events equally.
Ask one question for every event on that list. If this number changes tomorrow, does it change a business decision? Every event that fails that test is diluting the accuracy of every event that passes it.
Metrics You Need Before the Audit Begins
Before running a full audit, seven measurements reveal the severity of the problem and where the failure is most likely to be concentrated. These are not performance benchmarks. They are diagnostic readings — pulled once to confirm whether the data driving decisions can be trusted.
If any of these numbers are unavailable, that is not a gap to fill later. That is the first audit finding.
01. Data Completeness Rate Events tracked correctly ÷ Total expected events × 100
Measures how accurately user interactions are being captured against what should be tracked. Below 85 percent means significant behavior is invisible in every report built on this data.
Where to look: Tag manager preview mode. Analytics debug view. Backend order records versus analytics platform purchase event count for the same 30-day window.
02. Event Duplication Rate Duplicate event instances ÷ Total event instances × 100
Any duplication above zero percent on a purchase or lead event means every conversion-based decision is built on inflated numbers. Site updates, script movements, and container changes introduce duplication silently. The reporting layer never flags it.
Where to look: Analytics event count versus unique event count for every key conversion. Tag manager firing audit on a real checkout session.
03. Attribution Source Coverage Sessions with identified source and medium ÷ Total sessions × 100
A healthy rate sits above 80 percent. Below that, direct traffic is absorbing sessions that belong to paid and organic channels.
Where to look: Traffic acquisition report. Filter for direct and not-set source and medium. Cross-reference against active campaign spend in the same period.
04. Cross-Domain Attribution Integrity Conversions with correct original source ÷ Total conversions × 100
Every organization with checkout on a separate domain carries this risk. A variance above 10 percent between analytics platform attributed sources and ad platform click data for the same sessions confirms attribution is resetting at the boundary.
Where to look: Purchase event source and medium data in the analytics platform. Ad platform click reports for the same date range.
05. Consent Mode Coverage Rate Users tracked with full consent ÷ Total site users × 100
This number separates what was lost to user choice from what was lost to implementation failure. Those are two different problems with two different fixes.
Where to look: Consent signal reports in the analytics platform. Consent management platform audit trails. Acceptance rates versus market benchmarks.
06. Conversion Definition Accuracy Business outcome conversions ÷ Total marked conversions × 100
Above 90 percent means the attribution model is running on real business signals. Below 70 percent means it is averaging revenue outcomes with engagement noise.
Where to look: Full conversion event list in the analytics platform. Apply the single diagnostic question to every marked event.
07. Time to Insight Days from report delivery to decision made ÷ Number of reporting cycles
When a team spends more time questioning data than acting on it, the reporting layer has failed — regardless of tracking accuracy.
Where to look: How long it takes to answer one specific business question with confidence. If the answer requires manual reconciliation across sources, that is the answer.
Digital Analytics Audit Scorecard
| Metric | Healthy | Warning | Critical |
|---|---|---|---|
| Data Completeness Rate | Above 90% | 85–90% | Below 85% |
| Event Duplication Rate | 0% | 0.1–2% | Above 2% |
| Attribution Source Coverage | Above 80% | 65–80% | Below 65% |
| Cross-Domain Attribution Integrity | Below 5% variance | 5–10% variance | Above 10% variance |
| Consent Mode Coverage Rate | Above 70% | 50–70% | Below 50% |
| Conversion Definition Accuracy | Above 90% | 70–90% | Below 70% |
| Time to Insight | Under 2 days | 2–5 days | Above 5 days |
The Digital Analytics Audit Framework
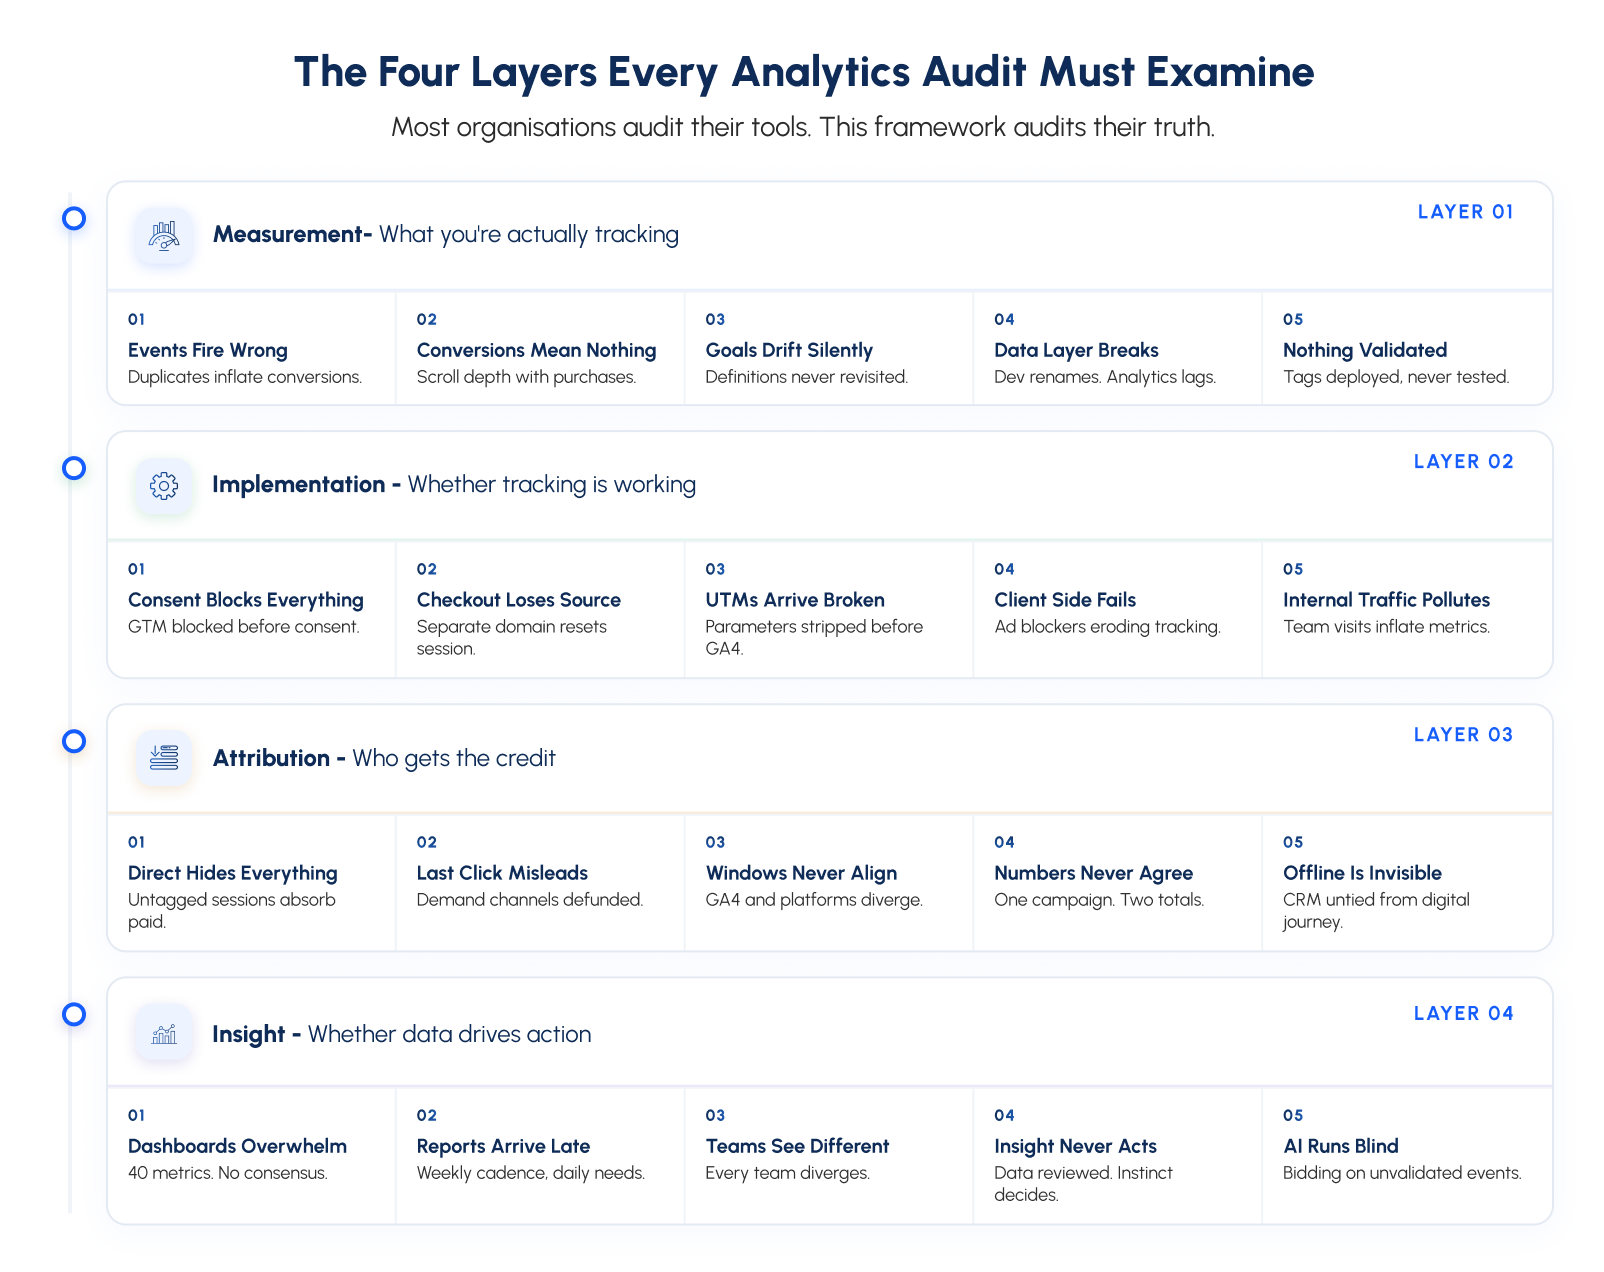
The Four Layers Every Digital Analytics Audit Must Examine
Most organizations audit their tools. This framework audits their truth.
Layer 01 : The Measurement Layer What You Are Actually Tracking
| Element | Three Word Title | Description |
|---|---|---|
| 01 | Events Fire Wrong | Duplicate firing inflates every conversion metric silently. |
| 02 | Conversions Mean Nothing | Scroll depth counted alongside actual purchases. |
| 03 | Goals Drift Silently | Conversion definitions from launch never reviewed. |
| 04 | Data Layer Breaks | Developer updates change variable names. Analytics never follows. |
| 05 | Nothing Gets Validated | Tags deployed. Never tested against real behavior. |
Layer 02 : The Implementation Layer Whether Tracking Is Working
| Element | Three Word Title | Description |
|---|---|---|
| 01 | Consent Blocks Everything | GTM blocked before consent can fire for the user. |
| 02 | Checkout Loses Source | Separate checkout domain resets every session to direct. |
| 03 | UTMs Arrive Broken | Parameters stripped before GA4 reads them. |
| 04 | Client Side Fails | Ad blockers are making browser based tracking unreliable. |
| 05 | Internal Traffic Pollutes | Team visits inflating metrics nobody has filtered out. |
Layer 03 : The Attribution Layer Whether Credit Goes to the Right Channel
| Element | Three Word Title | Description |
|---|---|---|
| 01 | Direct Hides Everything | Untagged sessions absorbing paid and organic performance. |
| 02 | Last Click Misleads | Demand channels defunded because they never close. |
| 03 | Windows Never Align | GA4 and ad platforms measure the same conversion differently. |
| 04 | Numbers Never Agree | Same campaign. Two platforms. Different conversion counts. |
| 05 | Offline Is Invisible | CRM conversions never tied to the digital journey that drove them. |
Layer 04 The Insight Layer Whether Data Drives Decisions
| Element | Three Word Title | Description |
|---|---|---|
| 01 | Dashboards Overwhelm Everyone | Forty metrics. Nobody agrees which three matter. |
| 02 | Reports Arrive Late | Weekly reporting on campaigns that needed action Tuesday. |
| 03 | Teams See Different | Marketing, finance, and product each pulling different numbers. |
| 04 | Insight Never Acts | Data reviewed every Monday. Decisions made on instinct. |
| 05 | AI Runs Blind | Automated bidding trained on unvalidated event data. |
How to Do a Digital Analytics Audit
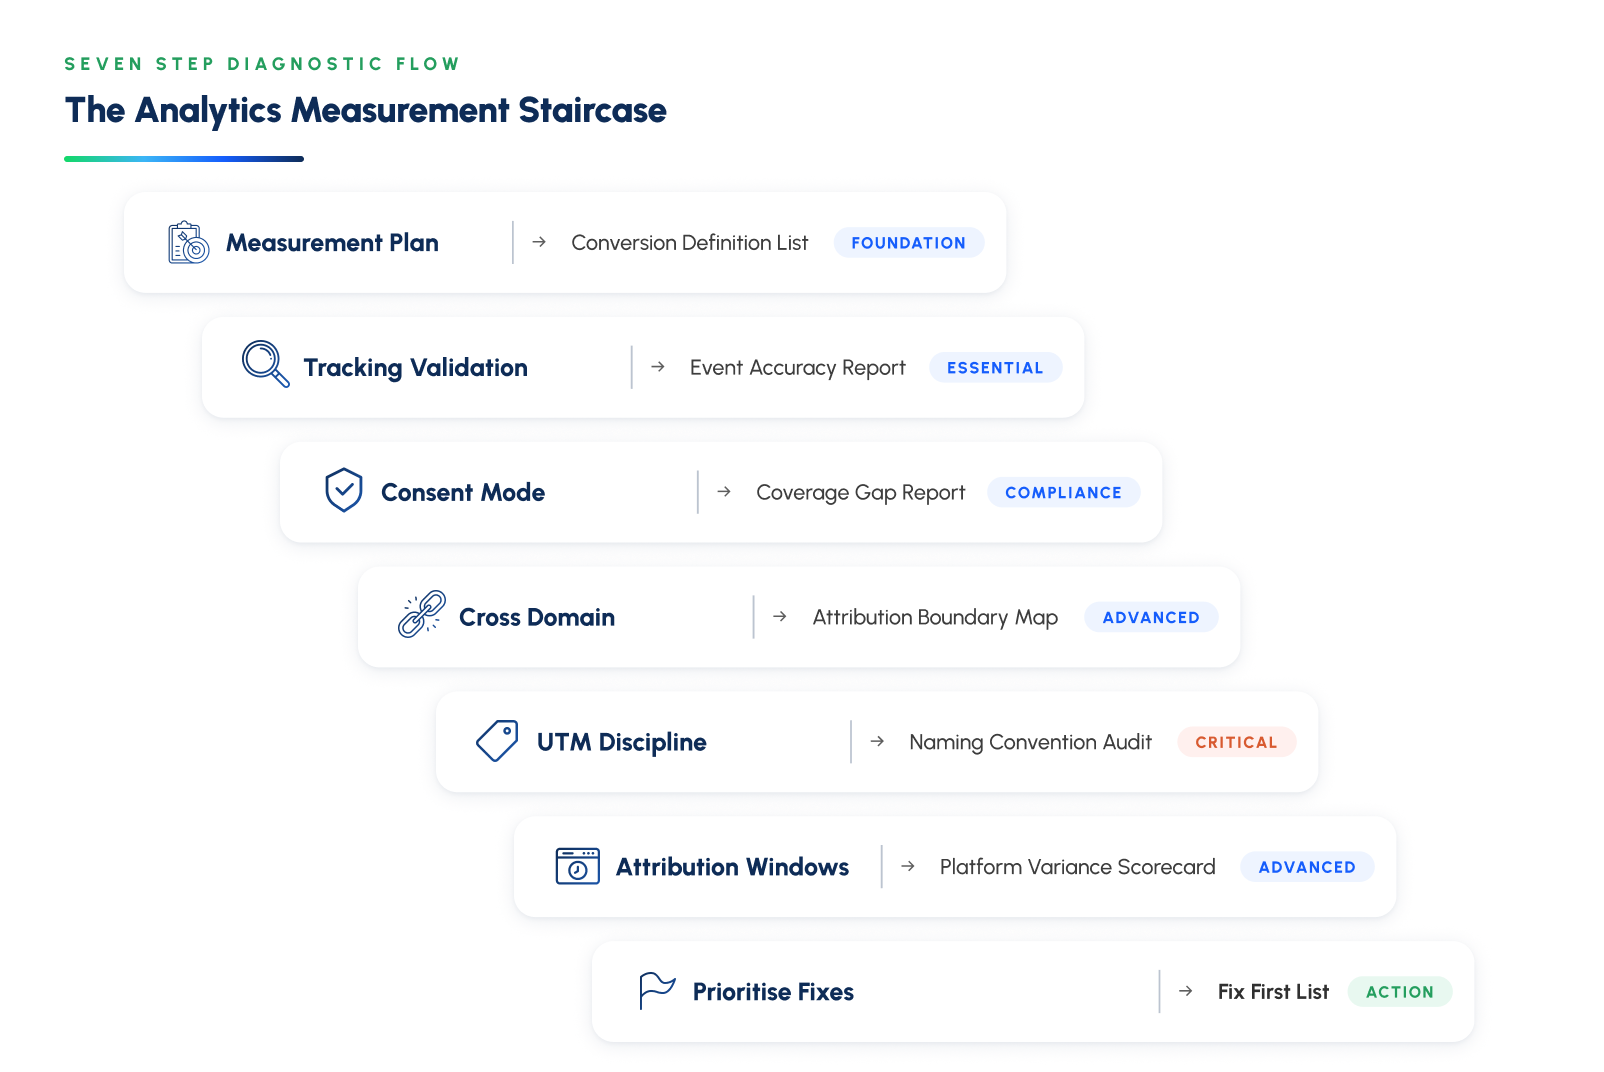
A digital analytics audit is seven steps run in sequence. Each one moves from symptom to measurement failure to the specific break causing the problem. Every step produces a finding. Every finding feeds one final answer.
01. Audit the Measurement Plan
Before checking whether tracking works, examine whether the right things are being tracked.
Pull every conversion event marked in the analytics platform. For each one ask one question. Does a change in this number change a business decision? If not, it should not be a conversion.
Then check for conversion definition drift. Events added over time without formal review are almost always the source of attribution noise nobody can explain.
You leave with: A clean conversion list mapped to real business outcomes and a record of every event removed and why.
02. Validate Every Tracking Implementation
Most analytics implementations contain errors that compromise data accuracy. Most environments are partially working at best.
Use the analytics platform debug view and tag manager preview mode to walk every key event against a real user journey. Homepage. Product page. Add to cart. Checkout. Confirmation.
At every step check three things. Is the event firing? Is it firing once? Is it passing correct values?
Pay particular attention to the confirmation page. This is where purchase events duplicate most often. Nobody knows until a finance reconciliation surfaces months later.
You leave with: A tracking validation report showing every event whether it fires correctly, whether it duplicates and whether it passes accurate values.
03. Audit Consent Mode Configuration
Test the full consent flow under every possible user decision.
Accept all cookies. Verify the analytics platform receives full session data. Decline all cookies. Verify cookieless pings reach the platform through Advanced Consent Mode.
Confirm the tag management container is not classified as a targeting script by the consent management platform. When it is blocked before consent fires nothing loads. Not because users declined. Because the implementation failed before consent was offered.
You leave with: A consent mode audit showing which signals reach the analytics platform under each consent condition and whether gaps reflect user choice or configuration failure.
04. Test Cross Domain Attribution
Walk every journey that crosses a domain boundary. Main site to checkout. Main site to payment provider. Web to booking platform.
If the source resets to direct after the boundary is crossed the cross domain configuration has failed. Every conversion after that boundary is attributed to directly regardless of what actually drove the session.
A variance above 10 percent between analytics platform sources and ad platform click data confirms the attribution is broken at the boundary.
You leave with: A cross domain report showing which boundaries preserve the original session source and which ones reset it to direct.
05. Audit UTM Discipline
Pull every active campaign URL across every channel and platform. Check UTM source medium campaign content and term for consistency. One naming convention. Every team. Every agency. Every platform.
Check for UTM stripping at redirects. Check for link shorteners that do not preserve parameters. Check for autotagging conflicts where platform click IDs and UTM parameters both present simultaneously.
You leave with: A UTM consistency audit showing every naming conflict and a single standardized convention for every channel going forward.
06. Audit Attribution Windows and Model Alignment
Pull the same campaign result from every platform simultaneously. Analytics platform. Ad platforms. The CRM. Same campaign. Same date range. Same conversion event.
If the numbers disagree, attribution is broken. A variance above 10 percent means budget decisions are being made on data that does not agree with itself.
Check attribution window settings in each platform. Different windows mean the same conversion gets counted in different reporting periods by different platforms. That is not a data problem. It is a configuration problem.
Then check whether incrementality testing has ever been run on the highest spend channel. Attribution models measure which touchpoints were present before a conversion. Not which caused it. Without incrementality testing the budget follows correlation not causation.
You leave with: An attribution scorecard showing variance per platform misaligned window configurations and whether attribution reflects causal impact or correlation.
07. Prioritise the Fixes
Every finding gets stacked against two criteria. Impact on decision quality and complexity of the fix.
High impact low complexity goes first. A duplicate purchase event inflating conversion data fixable with a single tag change goes before everything else.
High impact high complexity gets planned and resourced. Low impact gets deprioritised entirely.
The audit does not produce a list of tracking problems. It produces one clear answer on what to fix first and what fixing it is worth in recovered attribution accuracy and budget confidence.
You leave with: One prioritised fix list with a clear evidence backed answer on where to start and what each fix is worth.
You Know the Data Is Wrong Now Find Where :
Every decision last quarter ran on data. The question nobody asked is whether that data was accurate enough to act on.
A campaign paused because conversion rates dropped. A channel defunded because attribution showed it underperforming. The data supported every decision. The data was the problem.
The audit finds the exact break. One specific measurement failure traced to its root cause with a fix that works inside the implementation already running.
If your analytics data has never been formally audited start there. The readings will show where the measurement layer has been quietly producing the wrong numbers.
Already know what is broken and need it fixed automatically?
The audit finds the measurement failure. TrueMeasure fixes it and keeps it fixed. Every page. Every tag. Every release. Mistracked events. Dark data. Broken tracking. Corrected automatically before they reach a decision.