How to Do a CX Audit And Actually Fix What's Broken
Written by: Sanjana R
Updated on: 01-04-2026

component: CxAuditStickySection leftVariant: text progressTitle: "AUDIT PROGRESS" progressLabels:
- SIGNALS
- METRICS
- AUDIT stickySequence:
Section: Intro (opening paragraphs before first h2)
- cardTitle: "Still guessing where it breaks?" cardText: "Most teams look at numbers they have. A CX audit finds what they miss." leftCta: text: "Book a CX Audit" url: "https://www.xerago.ai/bootcamp/"
Section: Signs Your CX Has an Operational Problem
- cardTitle: "Sound familiar?" cardText: "The break is in your systems. A CX audit finds it. The Bootcamp fixes it." leftCta: text: "Book a CX Audit" url: "https://www.xerago.ai/bootcamp/"
Section: Metrics You Need Before the Audit Begins
- cardTitle: "Missing some of these baselines?" cardText: "We establish your CX baseline on Day 1 of the Bootcamp." leftCta: text: "Book a CX Audit" url: "https://www.xerago.ai/bootcamp/"
Section: CX Metrics Scorecard
- cardTitle: "Missing some of these baselines?" cardText: "We establish your CX baseline on Day 1 of the Bootcamp." leftCta: text: "Book a CX Audit" url: "https://www.xerago.ai/bootcamp/"
Section: The CX Audit Framework
- cardTitle: "Not sure where to start?" cardText: "Three layers. One answer. The Bootcamp works through all of them in 5 days." leftCta: text: "Book a CX Audit" url: "https://www.xerago.ai/bootcamp/"
Section: How to Do a CX Audit
- cardTitle: "Ready to run it on your stack?" cardText: "Seven steps to find the break. Five days to fix it. Guaranteed." leftCta: text: "Book a CX Audit" url: "https://www.xerago.ai/bootcamp/"
Section: You Know Where It Breaks. Now Fix It.
- cardTitle: "Done waiting for it to fix itself?" cardText: "The audit finds it. The Bootcamp fixes it. Free if not done in 5 days." leftCta: text: "Book a CX Audit" url: "https://www.xerago.ai/bootcamp/"
Section: Bootcamp Model
- cardTitle: "Ready to fix the break?" cardText: "One breakdown. Five days. A working solution inside your stack." leftCta: text: "Book a CX Audit" url: "https://www.xerago.ai/bootcamp/"
Section: FAQ
- cardTitle: "Still have questions?" cardText: "We have answers. Or we can show you how it works on your data." leftCta: text: "Book a CX Audit" url: "https://www.xerago.ai/bootcamp/"
When a quarter goes bad, everyone looks at the numbers they already have.
- Low conversion gets blamed on creativity.
- Churn gets blamed on pricing.
- Support volume gets blamed on the product.
It feels like action. It rarely fixes anything.
Because the real problem usually isn't in any of those places.
It's in the layer no one looks at. The systems, the handoffs, the data moving between tools that decide what a customer actually goes through when they deal with your business.
That gap costs more each year than most companies spend getting new customers. Not because the product is bad. Not because the price is wrong. Because no one ever looked at what was actually breaking underneath.
A CX audit is how you find it by going through every touchpoint, system, and handoff using your real data, so you can see exactly what's broken and what it's costing you.
NPS tells you a customer is unhappy. CSAT tells you where. A complete CX audit tells you which system broke, why it broke, and what fixing it is worth.
Here is how to find exactly where your experience is breaking.
Signs Your CX Has an Operational Problem
According to Forrester, CX quality has declined for four consecutive years. In 2025, 25% of US brands declined again.When churn rises, the instinct is to fix what's visible. The campaign. The onboarding flow. The support script. It rarely works. Because the problem usually isn't there. Here is what that looks like in practice.
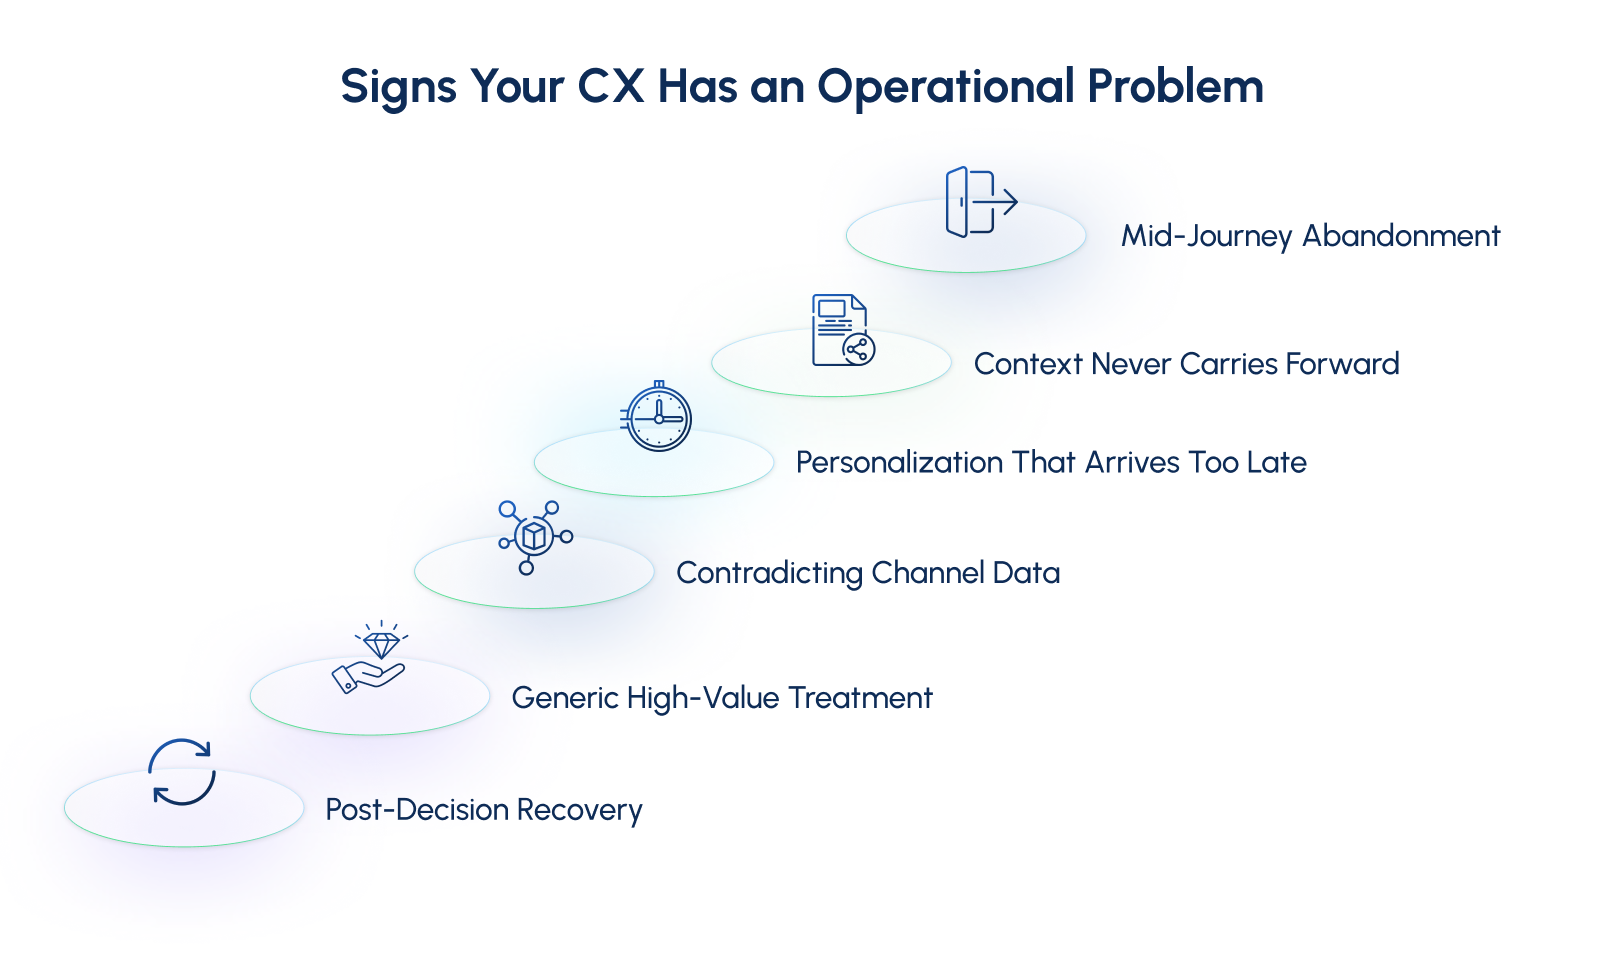
01. Mid-Journey Abandonment
A customer starts an application, gets interrupted, comes back Thursday. The session has expired. They start again, hit a silent upload error, close the tab and don't return.
Your funnel shows a drop at step four. That's all it shows. Not that this customer tried twice. Not that three thousand others hit the same wall last month. So the team rewrites the copy on step four. Simplifies the layout. The drop doesn't move.
The break was never the design. It was a silent system failure nobody was watching for because every team measures their piece of the journey, and nobody measures the whole thing.
02. Context Never Carries Forward
A customer explains their issue to support. It gets resolved. Two weeks later they contact a different channel. They explain everything again from the beginning.
Each channel runs on a separate system that shares nothing with the last one. The previous interaction exists somewhere in the stack. It just never reached the next agent. The customer experiences this as being completely unknown to a company they have been with for years.
03. Personalization That Arrives Too Late
A customer visits your pricing page three times. Compares plans. Starts a checkout and leaves without completing it. Your system detects this. A personalized offer arrives two days later.
The customer made their decision the day they left. By the time the system responded the customer had already moved on.
04. Contradicting Channel Data
A customer checks their balance on the app. Calls the branch. Visits the website. Three different numbers appear across three different channels.
Each channel pulls data from a different system at a different time. No single source of truth exists across the stack. Most customers expect consistent information regardless of which channel they use. Most organizations cannot deliver this because their systems were never designed to stay in sync.
05. Generic High-Value Treatment
A customer has been with the organization for seven years. Dozens of purchases. Full history recorded across multiple systems.
They contact support. The agent has no history in front of them. The customer is treated like someone who signed up yesterday. Most organizations have the data to deliver a better experience. The system simply never uses it at the moment it matters.
06. Post-Decision Recovery
Login frequency drops over three weeks. Transaction value declines. Support contacts increase. Every signal is visible in the data.
No intervention fires. The recovery workflow triggers the day after cancellation is confirmed. Customers show clear signs of leaving long before they actually cancel. By the time the save attempt arrives the customer has already decided.
Metrics You Need Before the Audit Begins
Before the audit begins you need seven numbers. Not to compare yourself to competitors. To understand what your systems are doing to your customers right now.
If a metric is unavailable that is not a gap to fill later. That is your first audit finding.
Perception Layer: What customers actually feel at every touchpoint
01. NPS : Net Promoter Score
Promoters % − Detractors % = Your real loyalty position
Measures how likely customers are to recommend you. Promoters score 9 to 10. Detractors score 0 to 6. Your NPS is Promoters minus Detractors.
A declining NPS quarter on quarter, even if still positive, is the earliest signal that something in the experience is eroding before it shows up anywhere else. Most teams only act when it goes negative. By then the damage had been compounding for months.
Where to look: NPS trend over the last four quarters broken down by customer segment and tenure.
02. CSAT : Customer Satisfaction Score
Satisfied Responses ÷ Total Responses × 100 = The truth about each touchpoint
Measures satisfaction at a specific interaction. Not the overall relationship. One moment. One step. This is where operational failures first become visible to customers before they become visible to your team.
A high overall CSAT with a low onboarding CSAT tells you exactly where the relationship begins to fracture. Overall scores hide the specific step that is failing. You need both to find the break.
Where to look: CSAT measured separately at checkout, onboarding, first support contact, and renewal.
03. CES: Customer Effort Score
Sum of All Effort Scores ÷ Total Responses = How hard your experience actually is
Measures how hard a customer had to work to complete something. Not whether they were satisfied. Whether it was easy. These are two different questions with two different answers.
High effort experiences are four times more likely to create disloyalty than high satisfaction experiences create loyalty. The easier the experience the more likely the customer returns. The harder it is the more likely they quietly leave.
Where to look: CES at every step where a customer has to complete something. A transaction, a form, a support resolution, an onboarding flow.
Operational Layer: What your systems are actually producing
04. FCR : First Contact Resolution
Issues Resolved First Time ÷ Total Issues × 100 = Your systems problem solving rate
Measures the percentage of customer issues resolved in a single interaction without requiring follow up. This number tells you whether your systems are giving agents the information and tools they need to resolve issues the first time.
When FCR is low it means customers are coming back for the same problem. The resolution did not happen because the system did not surface the right information at the right moment.
Where to look: FCR rate broken down by channel. Chat, call, email, and in-app separately.
05. Repeat Contact Rate
Repeat Contacts ÷ Total Contacts × 100 = How often your systems fail the same customer twice
Measures how often the same customer contacts you for the same problem within 30 days. When this number is high your channels are not sharing context with each other.
Every repeat contact means the previous interaction either did not resolve the issue or the resolution never reached the next system the customer touched. Both are system failures. Neither is visible without this metric.
Where to look: Repeat contact rate per channel and per issue category over the last 90 days.
Financial Layer: What the experience is worth and what losing it costs
06. CLV : Customer Lifetime Value
Average Purchase Value × Purchase Frequency × Customer Lifespan = Revenue at stake per customer
Measures the total revenue a customer generates across the full duration of their relationship. This is the financial lens through which every other metric should be read.
A customer churned at month 6 versus month 36 is not the same loss. Every finding the audit uncovers becomes more meaningful when measured against the CLV of the customers it involves. Without this number every finding is a problem without a price attached to it.
Where to look: CLV broken down by customer segment, acquisition channel, and product line.
07. Churn Rate
Customers Lost ÷ Customers at Start of Period × 100 = The visible output of invisible failures
Measures the percentage of customers who stopped doing business with you in a given period. Churn is not the problem. It is the outcome. The problem is whatever operational failure caused it earlier in the journey.
A rising churn rate that cannot be explained by price or product changes is almost always an experience failure. The audit traces it back to the specific break producing it.
Where to look: Churn rate by segment, tenure, and product line over the last six months.
CX Metrics Scorecard
| Metric | Scale | Healthy | Warning | Critical |
|---|---|---|---|---|
| Net Promoter Score (NPS) | -100 to +100 | Above 50 | 0 to 30 | Below 0 |
| Customer Satisfaction (CSAT) | 0 to 100% | Above 80% | 70 to 75% | Below 70% |
| Customer Effort Score (CES) | 1 to 7 | Above 5.5 | 4 to 5.5 | Below 4 |
| First Contact Resolution (FCR) | 0 to 100% | Above 75% | 65 to 75% | Below 65% |
| Repeat Contact Rate | 0 to 100% | Below 10% | 10 to 25% | Above 25% |
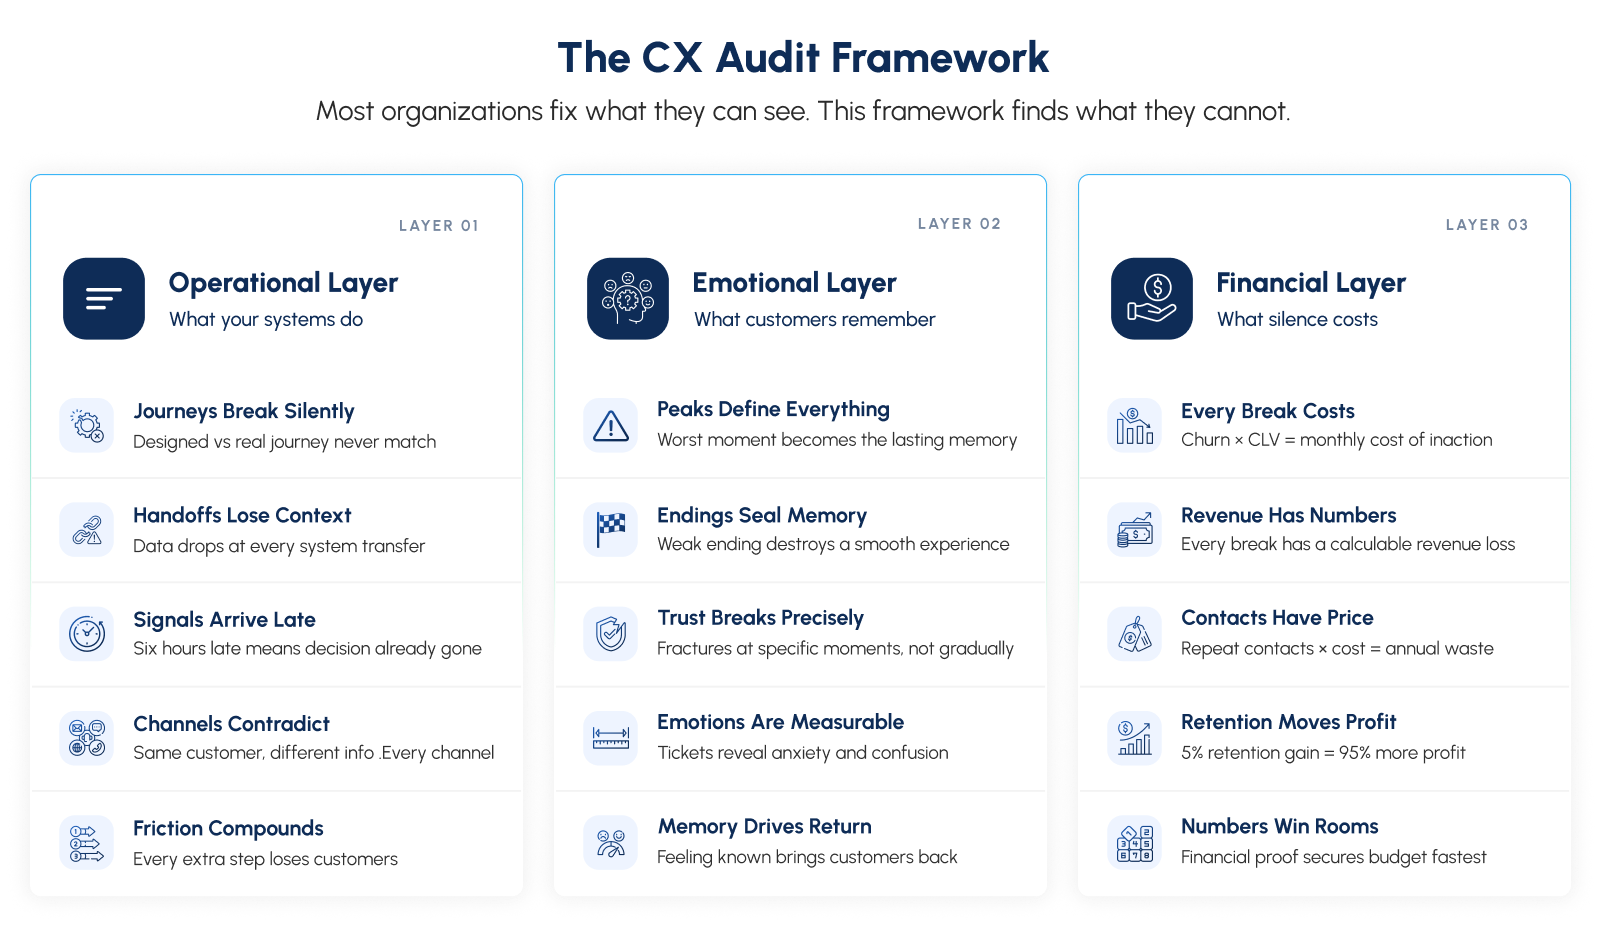
The CX Audit Framework
Most organizations audit what they can measure and stop there. But the operational layer only tells you what broke. The emotional layer tells you what it damages. The financial layer tells you what it is costing. All three together give you the complete picture.
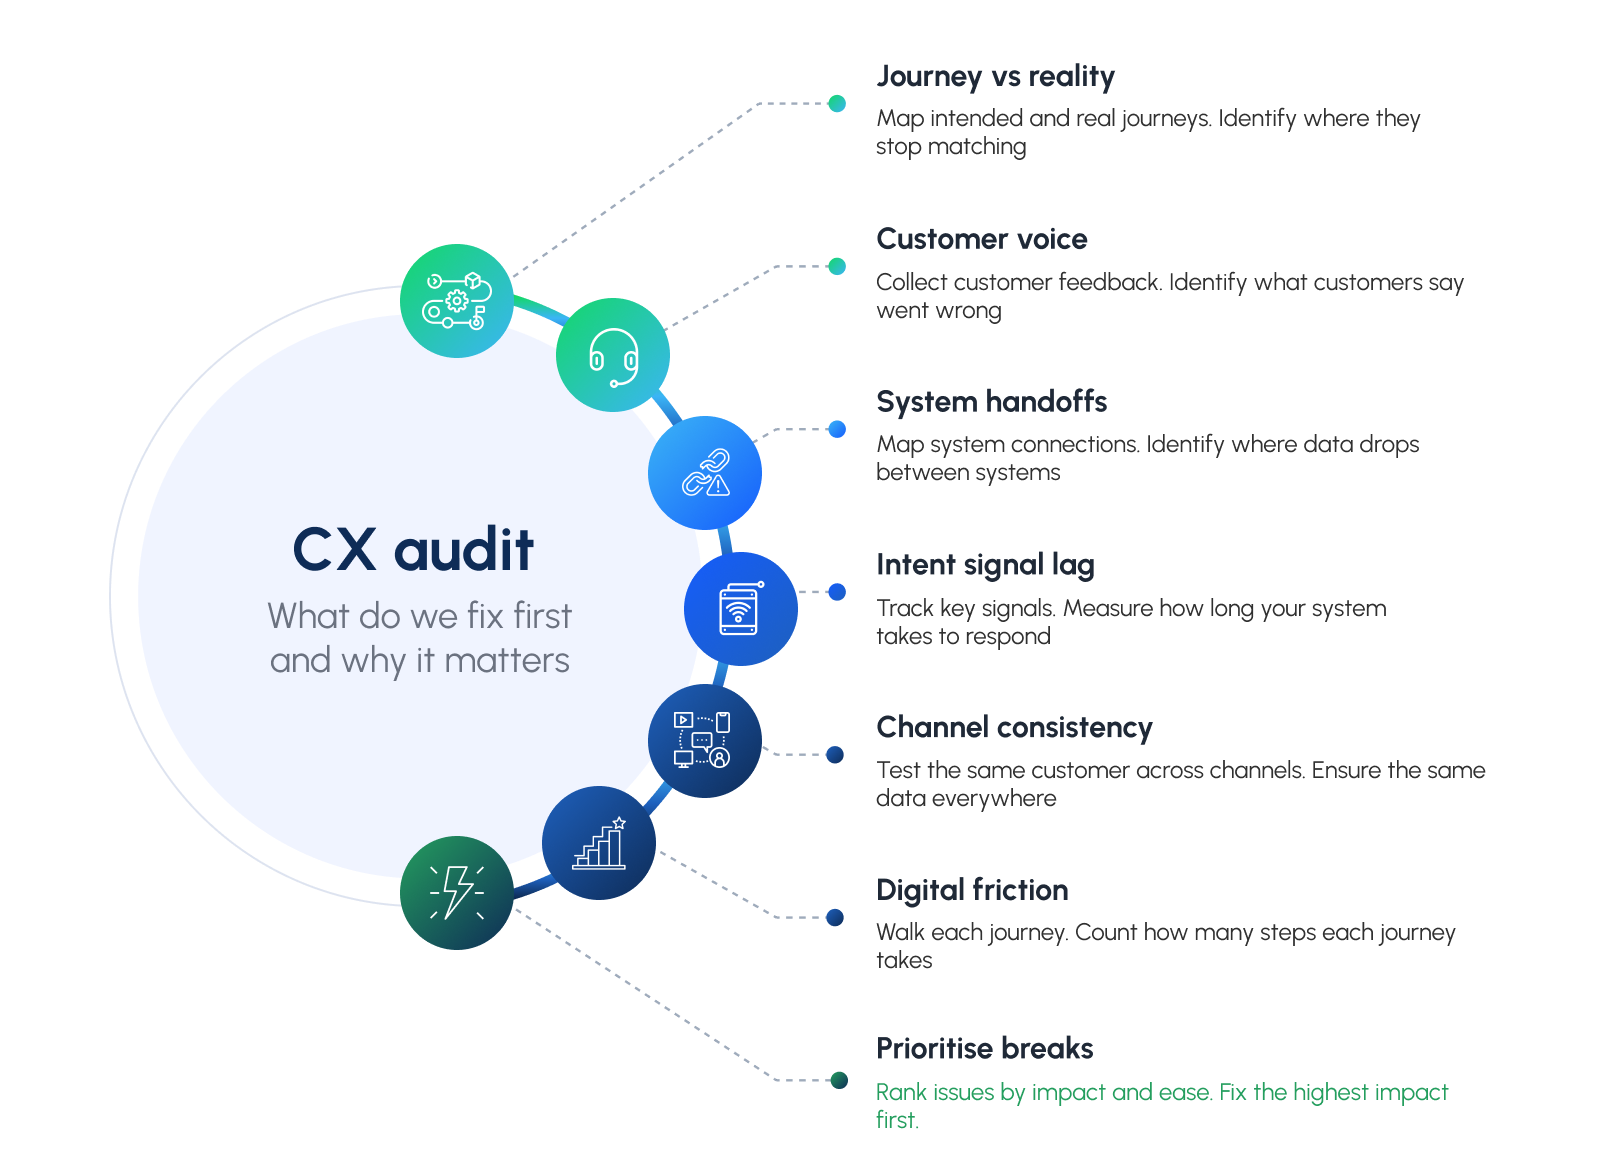
How to Do a CX Audit
A CX audit is seven steps run in sequence.
01. Map the Intended Journey Against Reality
Your journey looks fine on paper. It is not fine in practice.
Pull your three highest traffic journeys. Acquisition, transactional, and retention.
Map every intended step against your actual funnel data and your Voice of Customer data side by side. Where the two diverge consistently that is a system failure. Not a user behaviour problem.
Do not stop at where customers drop off. Find which specific step is causing it. Cross reference your funnel data with support ticket language and customer interview findings. The step causing the drop almost never surfaces in analytics alone.
You leave with: A journey break list showing which step breaks, on which device, and from which entry point.
02. Listen to What Customers Actually Say
Your data shows where customers stopped. Your customers can tell you why.
Pull the last 90 days of support tickets verbatim. Read the actual language. Cluster the top five themes by frequency. Those five themes are your five biggest operational failures in the customer's own words.
Pull every open text NPS Detractor comment from the last two quarters. Not the score. The words. The patterns will repeat faster than you expect.
Run five to seven customer interviews. Not surveys. Conversations. Ask them to walk you through the last time something went wrong. That one question reveals more than any dashboard ever will.
You leave with: A customer evidence file showing the top five failure themes ready to validate every finding the systems data produces.
03. Audit Every System Handoff
Your systems look connected. Most of them are not.
Map every handoff in your stack. Web to mobile. Mobile to support. Support for CRM. CRM to marketing automation.
For each one ask four things. Is data arriving? Is it real time or batched? Is the customer ID consistent? Is the same customer recognised as the same person across every platform.
Most organizations have at least one handoff silently failing right now. Customer ID mismatch is the root cause of most handoff failures. Without a consistent identity every system is effectively meeting a stranger each time.
You leave with: A handoff health map rating every connection as intact, batched, or broken.
04. Measure Intent Signal Lag
Your customer signalled. Your system responded too late.
Test your three highest value signals. Cart abandonment. Cancellation page visit. Declining login frequency.
Measure the time from signal detected to first action fired. Best in class operations respond within 30 minutes. Most organizations are running at 6 to 12 hours.
Real time personalization consistently outperforms delayed personalization on conversion. Every hour of lag is a moment your system could have acted but did not.
You leave with: A lag report showing which signals are viable and which are arriving too late to matter.
05. Test Context Consistency Across Channels
Your customer got a different answer depending on where they looked.
Pick five data points. Account balance, loyalty status, open support ticket, last transaction, and active offer.
Run the same customer across web, mobile, branch, and call centre simultaneously. Check the numbers. Then check the experience. A system can show consistent data and still feel completely disconnected if tone, context, and response differ by channel.
Data consistency and experience consistency are two different problems. Most organizations solve one and assume they have solved both. The audit needs to find each one separately.
You leave with: A consistency scorecard rating each data point and each experience across every channel.
06. Score Digital Friction Per Journey
Your customer did not lack patience. Your journey asked for too much effort.
Walk each journey yourself. Count everything. Every step, every field, every redirect, every error state.
Pay specific attention to error messaging. What happens when something goes wrong tells you more about the experience than what happens when everything works. An error surfacing after submission is not a UX issue. It is a trust failure.
Reducing customer effort is a stronger predictor of loyalty than increasing satisfaction. Friction does not just reduce completions. It changes how customers feel about doing business with you long after the interaction ends.
You leave with: A friction scorecard showing the exact effort cost of each journey end to end.
07. Prioritise the Breaks
You have findings. Now you need one answer.
Stack every finding against two criteria. Impact, how many customers are affected and what it costs. Fixability, whether it needs your existing stack or new infrastructure.
High impact and high fixability goes first. High impact and low fixability gets planned. Low impact gets deprioritised entirely.
Not every break costs the same. Not every fix needs the same investment. The audit does not produce a list of problems. It produces one clear answer on what to fix first and why.
You leave with: One prioritised fix list with a clear evidence backed answer on where to start.
You Know Where It Breaks. Now Fix It.
Your customers are not leaving because of your brand.
They are leaving because of what happens between your systems. A handoff that drops context. A recovery trigger that fires too late. A personalization engine running on data that stopped being accurate months ago.
They do not complain about it. They just leave.
Every day without the fix is another day the problem compounds. Another customer lost to a break your team could not see. Another recovery that fired six hours after the decision was made. Another signal detected and acted on too late to matter.
The cost of inaction is not a future risk. It is happening right now in your numbers.
The audit finds the exact break.
Not a category of problems. Not a list of recommendations. One specific failure, traced to its operational root cause, with the evidence to prove it and the roadmap to fix it.
The Bootcamp fixes it in 5 days.
Not a demo environment. Not a proof of concept. A working solution built inside your existing stack, validated against your real data, owned and operated by your team from day one.
And if the breakdown is not fixed in 5 days it is free.
Customers who feel genuinely known by a brand stay 5.1 years longer and deliver 306 percent higher lifetime value. That is not a CX goal. That is the financial return on fixing what the audit finds. (Motista)
The question is not whether the break exists. You already know it does. The question is how long you are willing to leave it unfound.
Bootcamp Model
Every week it stays unfound is another week it compounds.
One audit. One breakdown identified. One Bootcamp. Five days to fix it.
FAQ section
01. We already run NPS and CSAT surveys. Do we still need a CX audit?
NPS and CSAT tell you how customers feel. They do not tell you which system is causing it. Surveys do not look inside the stack. A CX audit looks where surveys cannot.
02. We do not have a dedicated CX team. Can we still run this?
Yes. The audit does not require a CX team. It requires access to funnel data, support tickets, and system architecture. A small cross-functional group with access to the right data can run every step.
03. We recently redesigned our journey. Why would breaks still exist?
Journey redesigns fix the experience layer. Most breaks live in the systems layer underneath. A redesigned journey running on the same disconnected stack produces the same handoff failures and the same context loss as before. The design changed. The data architecture did not.
04. How do we know which break to fix first?
Step seven answers exactly this. Stack every finding against two criteria. Impact and fixability. The break affecting the most customers that can be fixed with your existing stack goes first.
05. Our churn rate looks normal. Should we still audit?
A normal churn rate means customers are leaving at an expected rate. It does not mean the experience is healthy. Most organizations find at least one fixable break even when headline numbers look acceptable.